Monitoring servers without installing agents
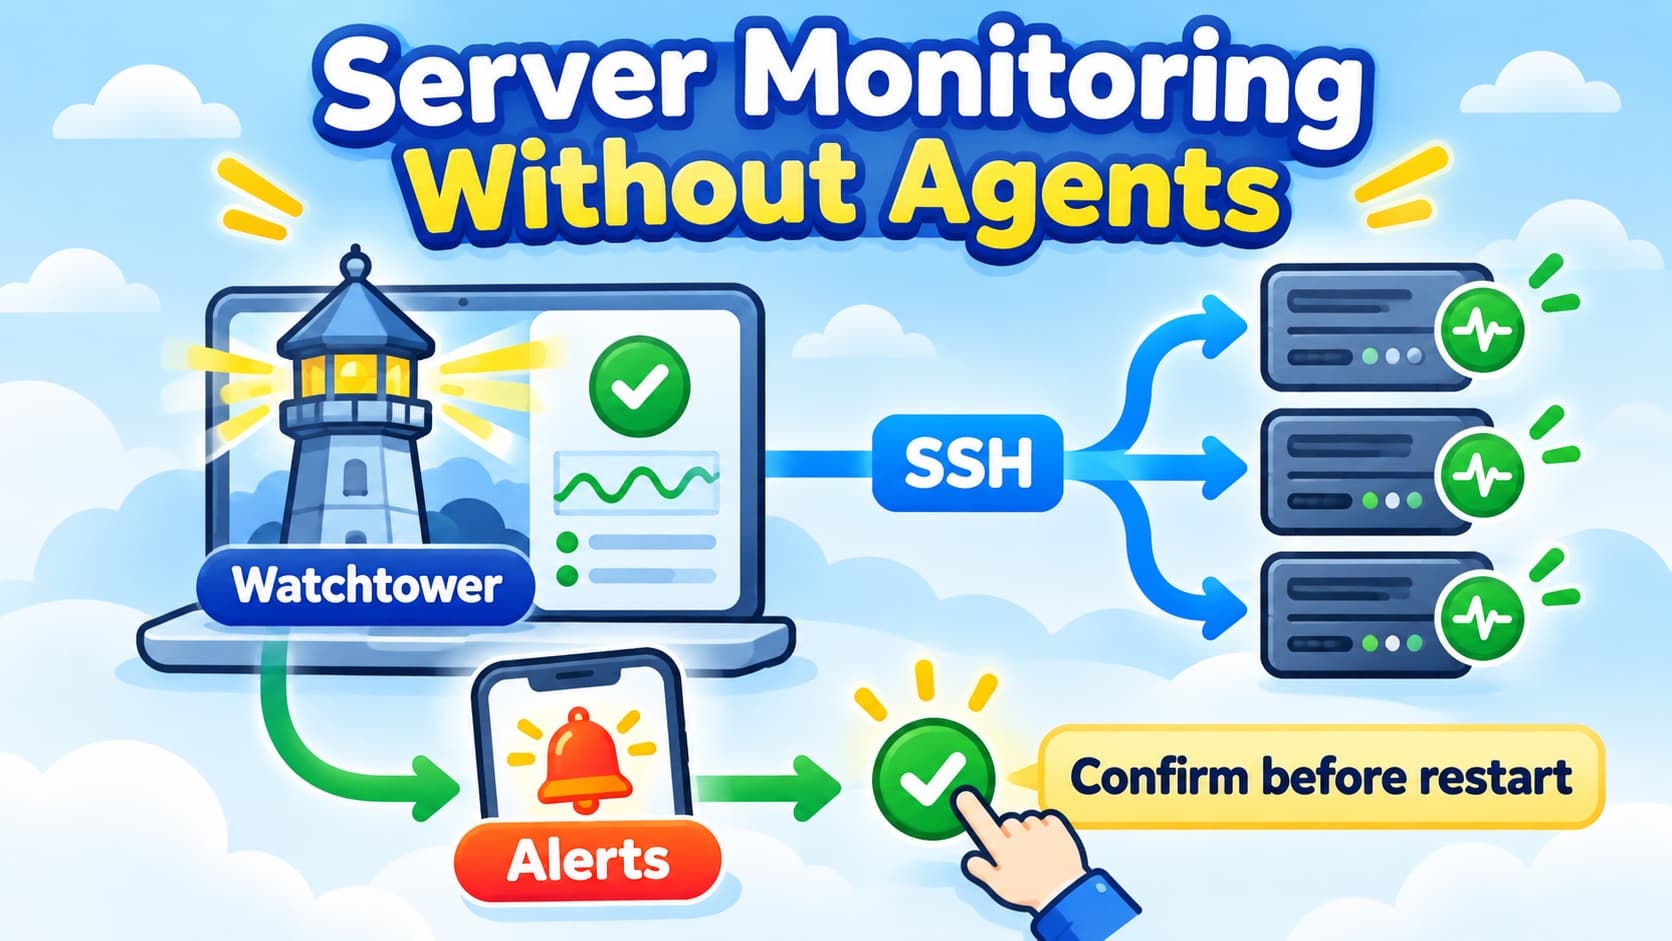
A website can open while an important part of the application is broken. The home page might work, but checkout might fail. A process might be running, but every request to it might return an error.
That is why monitoring starts with choosing what you want to check. A green status needs to mean something specific.
While building Watchtower, my open-source monitoring dashboard, I used endpoint checks and SSH-based service checks. They answer different questions. Here is how to think about those choices before setting up a monitoring system.
1. Start with the behaviour you care about
For a small application, write down the actions people depend on. They might include opening the website, signing in, submitting a form or completing a purchase.
Then decide what each check can prove:
- Website or health endpoint: the endpoint responds as expected. It does not prove every important user journey works.
- Network port: a connection to that port succeeds. It does not prove the application gives a useful response.
- Process or container status: the service reports that it is running. It does not prove users can use it successfully.
Checking the website from outside resembles a user's view. Reading internal service status gives another view. Google's SRE guide explains this distinction between externally visible behaviour and internal signals.
2. Compare the ways to collect those signals
Option A: Check from outside
A monitoring service requests a public endpoint and checks the response. It can also check whether a network connection succeeds.
This is a useful place to start when the question is, “Can someone reach my application?” It requires little involvement from the application, but a failed check usually gives limited information about the cause.
For example, a failed request could come from the application, its network path or a dependency. You still need to investigate.
Option B: Collect signals inside the system
An installed agent or an application metrics endpoint can provide internal measurements. Those might include memory use, request counts, errors or response times.
This helps when you need more detail than an up/down check. It also gives you more software or instrumentation to maintain, and more measurements to choose from.
Metrics systems such as Prometheus are built around collecting and querying measurements. A process-status check and a metrics system serve different levels of investigation.
Option C: Check services over SSH
A monitoring server connects to a machine over SSH and asks for the status of a service already running there. That can cover a Docker container, a PM2 process or a systemd service.
This avoids installing a separate monitoring agent on that machine. It does require working SSH access, protected credentials and carefully limited operations.
This is the approach Watchtower uses for its runtime checks, alongside HTTP and TCP checks. If SSH fails, the monitoring system needs to report that failed check; it cannot assume the service behind it is healthy.
3. Combine checks when they answer different questions
Consider a container that reports “running” while its website returns errors.
The container check helps you inspect the service. The HTTP check tells you what happened to a request. Keeping both results gives you more context than choosing one and treating it as proof of everything.
You can start with a public endpoint check, add service checks where they help investigation, and add detailed metrics when you need trends or deeper diagnosis. You do not have to introduce every monitoring technique at once.
4. Turn failed checks into useful alerts
One failed request can come from a short interruption. Repeated failures are a different signal.
A failure threshold lets you choose how many failed checks should count as an outage. Here is an illustrative rule with a threshold of three:
- First failed check: record the failure and check again.
- Second consecutive failure: the problem is still present.
- Third consecutive failure: open an incident and notify the operator.
- A successful check later: record recovery and close the incident according to the policy.
A lower threshold can detect trouble sooner but may create more noise. A higher threshold can reduce short-lived alerts but delays notification. The check interval also affects how quickly you notice a failure.
Watchtower records check results, opens incidents after its configured failure threshold, and can send push notifications when a service goes down or recovers.
5. Make restart actions deliberate
An alert should help someone inspect the failure before changing the service. Restarting a process may help, but it may also interrupt work or hide evidence needed to investigate.
Watchtower requires the operator to confirm the service name before a restart and records the action in an audit log. Access to that action is restricted by role.
After any restart, check the result again. A successful restart command tells you the command completed; a later health check tells you whether the service is responding as expected.
Start with a few checks you can explain. For each one, write down what it proves, who receives its alert and what that person should inspect next.